SSC CGL 2019 objective Ques (3 results)
1)Study the graph and answer the question that follows. What is the ratio of the total number of workers whose daily wages are less than ₹500 to the total number of workers whose daily wages are ₹600 and above?
SSC CGL 2019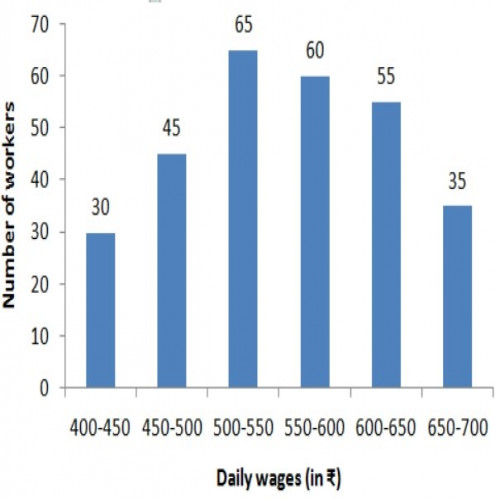
5 : 6
Total number of workers whose daily wages are less than ₹500 = 30 + 45 = 75
Total number of workers whose daily wages are ₹600 and above = 55 + 35 = 90
ratio of the total number of workers whose daily wages are less than ₹500 to the total number of workers whose daily wages are ₹600
and above = 75 : 90 = 5 : 6
2)The given graph shows the weights of students in a school on a particular day. Study the graph and answer the question.
The number of students weighing less than 50 kg is what percent less than the number of students weighing 55 kg or more?
SSC CGL 2019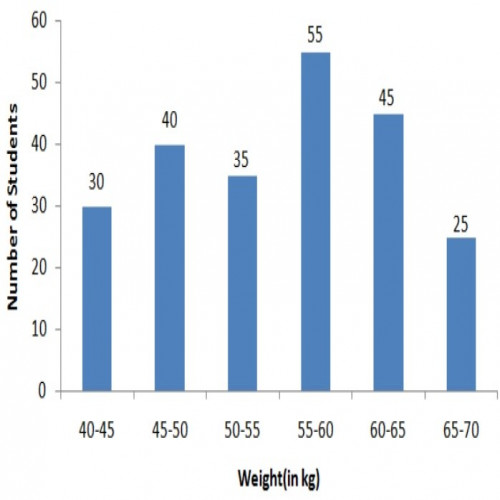
44
3)The given graph shows the marks obtained by students in an examination. Study the graph and answer the question. The number of students who obtained less than 300 marks is what percent more than the number of students who obtained 350 or more marks?
SSC CGL 2019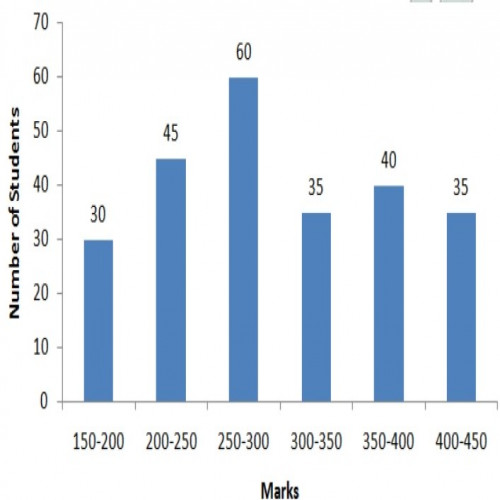
80%